Hello Image Segmentation
A very basic introduction to using segmentation models with OpenVINO.
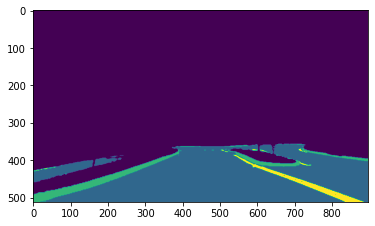
We use the pre-trained road-segmentation-adas-0001 model from the Open Model Zoo. ADAS stands for Advanced Driver Assistance Services. The model recognizes four classes: background, road, curb and mark.
Imports
import cv2
import matplotlib.pyplot as plt
import numpy as np
import sys
from openvino.runtime import Core

sys.path.append("../utils")
from notebook_utils import segmentation_map_to_image
Load the Model
ie = Core()

model = ie.read_model(model="model/road-segmentation-adas-0001.xml")
compiled_model = ie.compile_model(model=model, device_name="CPU")

input_layer_ir = compiled_model.input(0)
output_layer_ir = compiled_model.output(0)
Load an Image
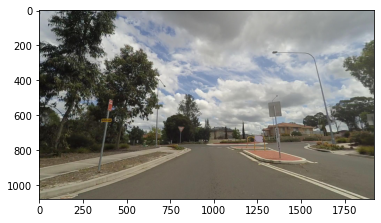
A sample image from the Mapillary Vistas dataset is provided.
# The segmentation network expects images in BGR format
image = cv2.imread("data/empty_road_mapillary.jpg")

rgb_image = cv2.cvtColor(image, cv2.COLOR_BGR2RGB)
image_h, image_w, _ = image.shape

# N,C,H,W = batch size, number of channels, height, width
N, C, H, W = input_layer_ir.shape

# OpenCV resize expects the destination size as (width, height)
resized_image = cv2.resize(image, (W, H))

# reshape to network input shape
input_image = np.expand_dims(
    resized_image.transpose(2, 0, 1), 0
)
plt.imshow(rgb_image)
<matplotlib.image.AxesImage at 0x7efd75441c40>

Do Inference
# Run the inference
result = compiled_model([input_image])[output_layer_ir]

# Prepare data for visualization
segmentation_mask = np.argmax(result, axis=1)
plt.imshow(segmentation_mask.transpose(1, 2, 0))
<matplotlib.image.AxesImage at 0x7efd753b8670>

Prepare Data for Visualization
# Define colormap, each color represents a class
colormap = np.array([[68, 1, 84], [48, 103, 141], [53, 183, 120], [199, 216, 52]])

# Define the transparency of the segmentation mask on the photo
alpha = 0.3

# Use function from notebook_utils.py to transform mask to an RGB image
mask = segmentation_map_to_image(segmentation_mask, colormap)
resized_mask = cv2.resize(mask, (image_w, image_h))

# Create image with mask put on
image_with_mask = cv2.addWeighted(resized_mask, alpha, rgb_image, 1 - alpha, 0)
Visualize data
# Define titles with images
data = {"Base Photo": rgb_image, "Segmentation": mask, "Masked Photo": image_with_mask}

# Create subplot to visualize images
fig, axs = plt.subplots(1, len(data.items()), figsize=(15, 10))

# Fill subplot
for ax, (name, image) in zip(axs, data.items()):
    ax.axis('off')
    ax.set_title(name)
    ax.imshow(image)

# Display image
plt.show(fig)
