Visualize Model Output
DL Workbench enables you to visually estimate how well a model recognizes images by testing the model on particular sample images. This functionality considerably enhances the analysis of inference results, giving you an opportunity not only to estimate the performance, but also to visually understand whether the model works correctly and the accuracy is tolerable for client applications.
To get a visual representation of the output of your model, go to the Perform tab on the Projects page and open the Visualize Output tab.
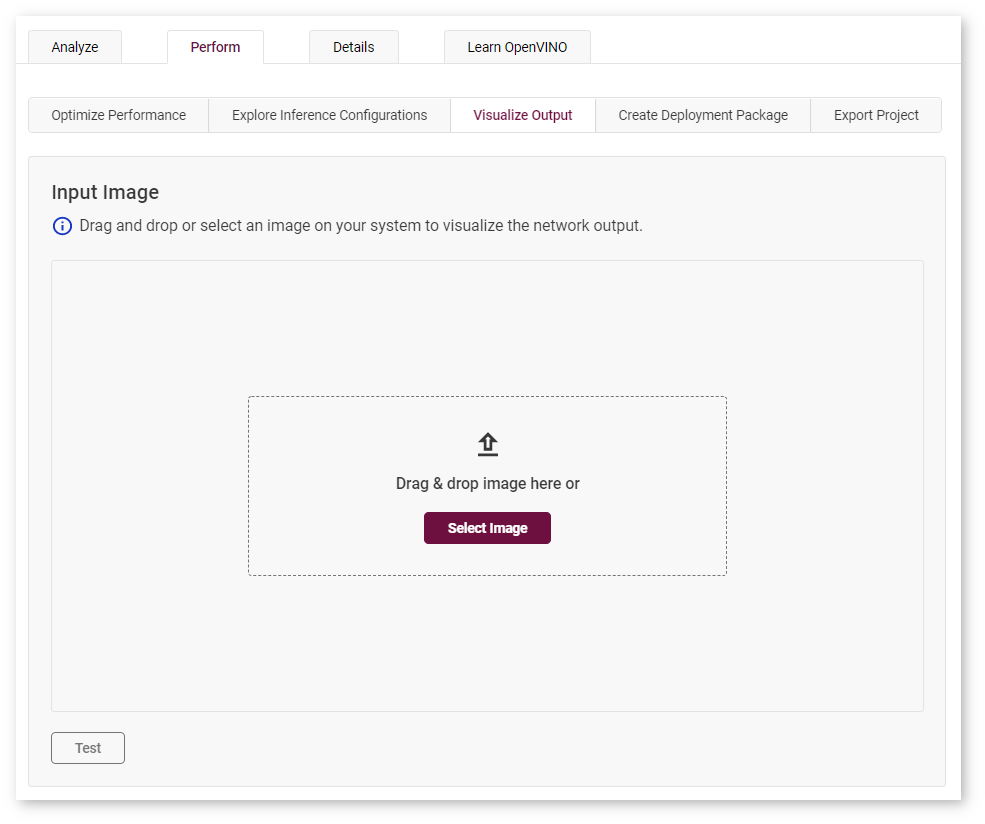
There are three ways to visualize model output in the DL Workbench:
Model Predictions
Note
The feature is available for models trained for the following tasks:
Classification
Object-Detection
Instance-Segmentation
Semantic-Segmentation
Super-Resolution
Style-Transfer
Image-Inpainting
Select an image on your system or drag and drop an image directly. Click Test, and the model predictions appear on the right.
Classification Models
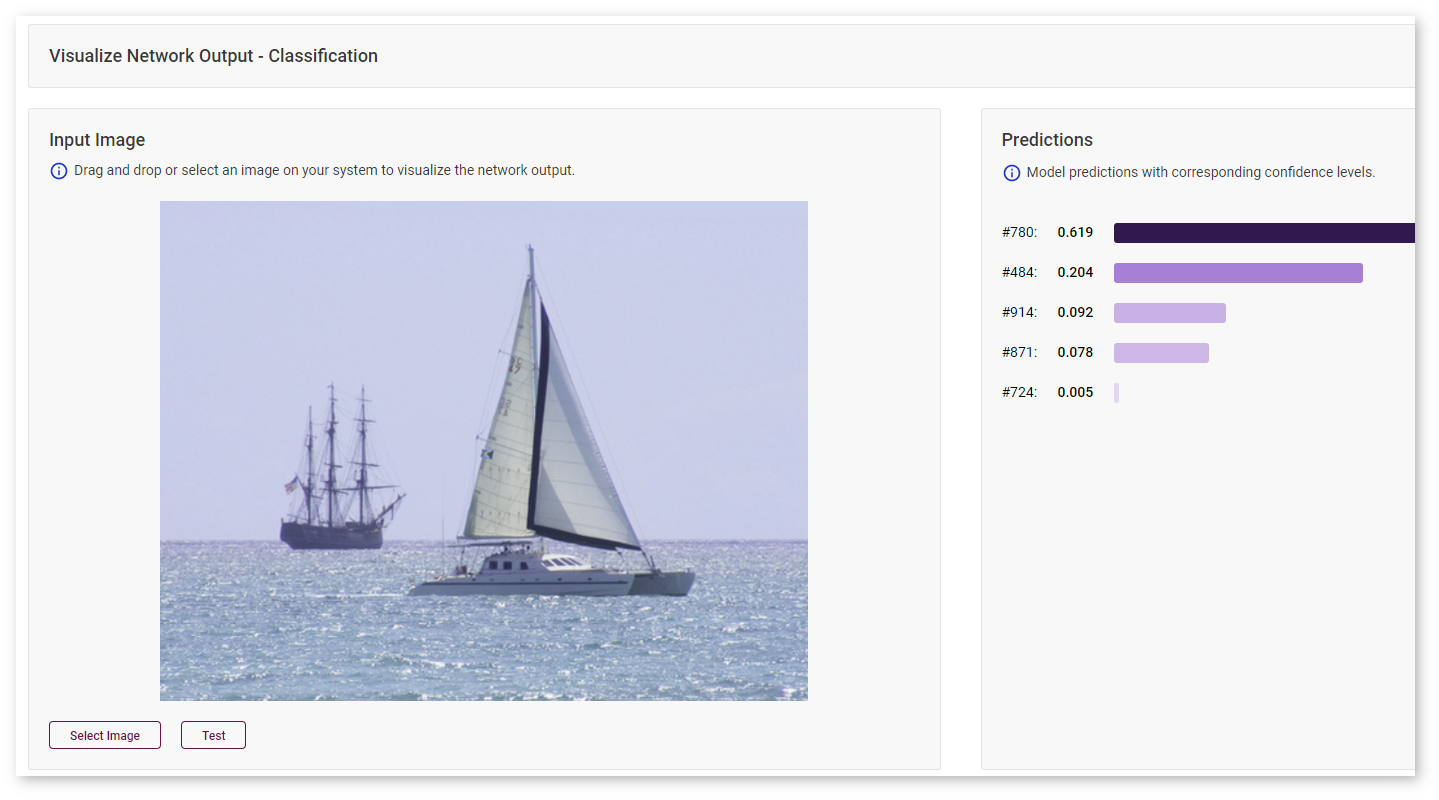
Predictions for a classification model with corresponding confidence levels are sorted from the highest confidence rate to the lowest.
Object-Detection Models
With object-detection models, you can visualize bounding boxes by hovering your mouse over a class prediction on the right.
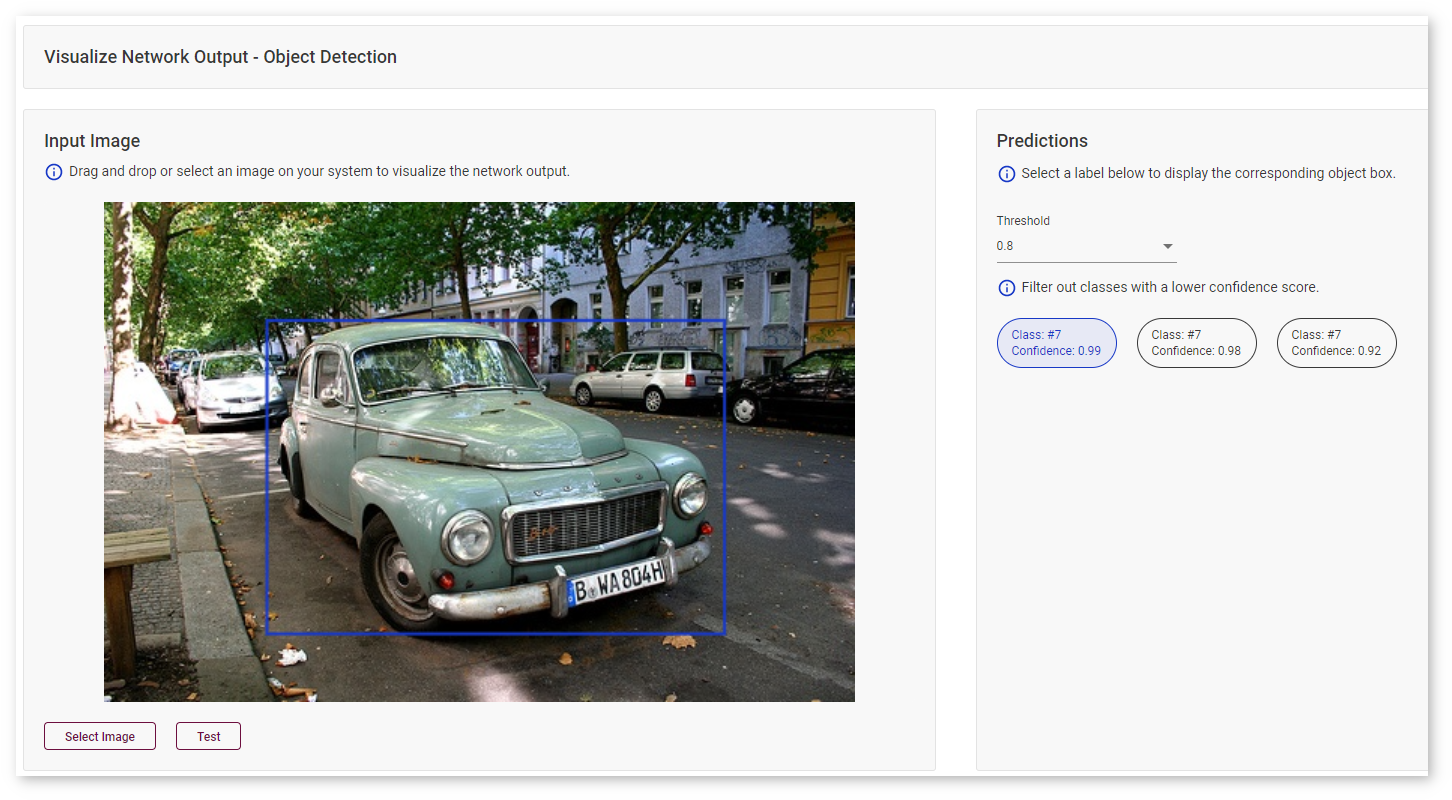
Use the Threshold drop-down list to filter classes based on the confidence score.
Instance-Segmentation Models
With instance-segmentation models, you can visualize masks by hovering your mouse over a class prediction on the right.
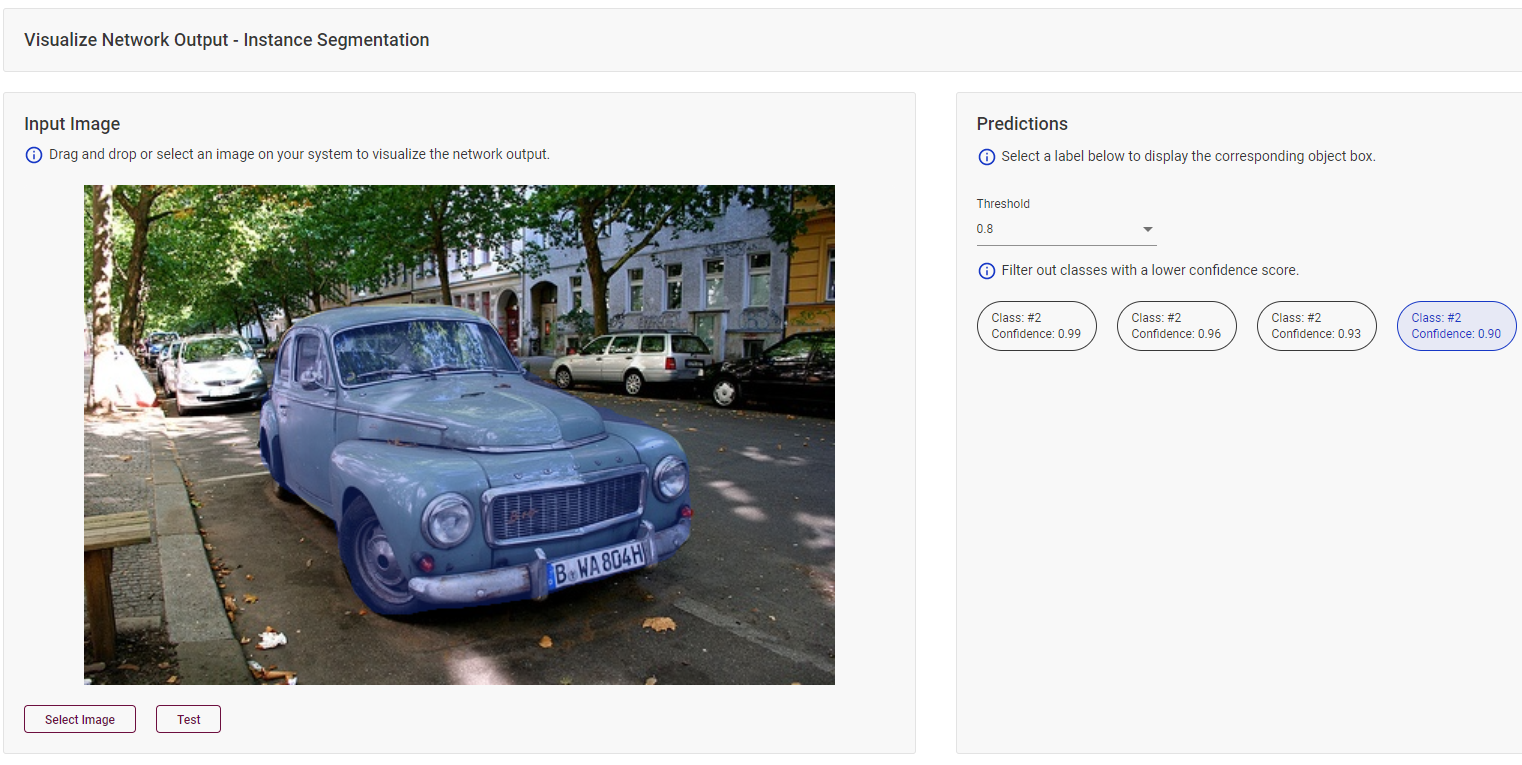
Use the Threshold drop-down list to filter classes based on the confidence score.
Semantic-Segmentation Models
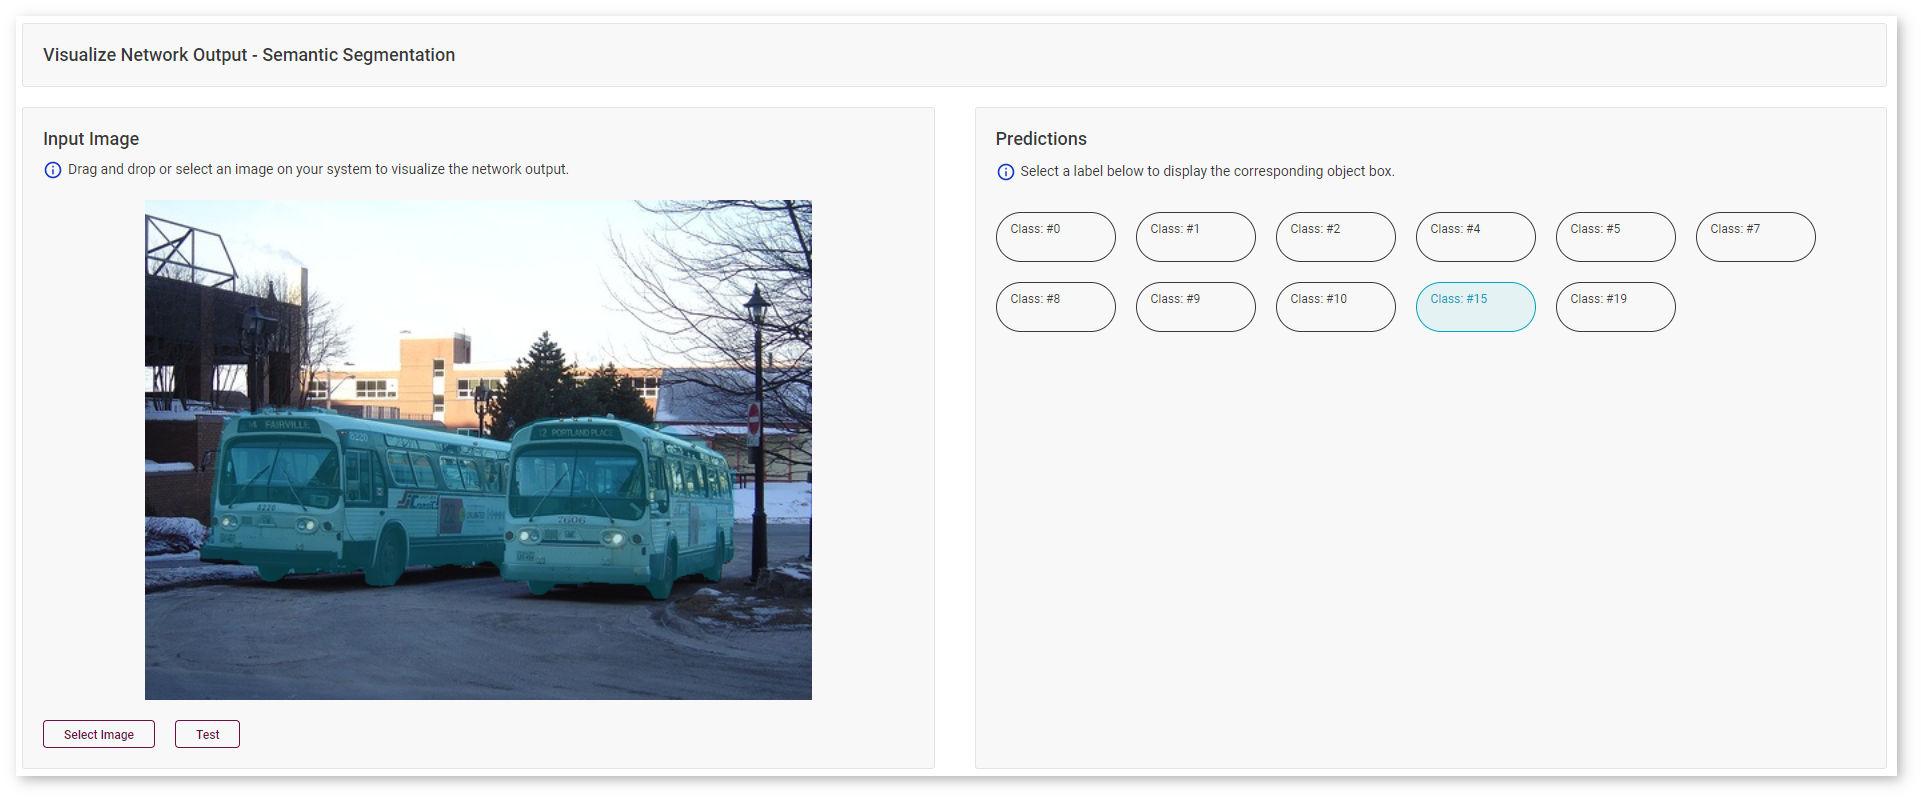
For semantic-segmentation models, the DL Workbench provides areas of categorized objects, which enables you to see whether your model recognized all object types, like the buses in this image:
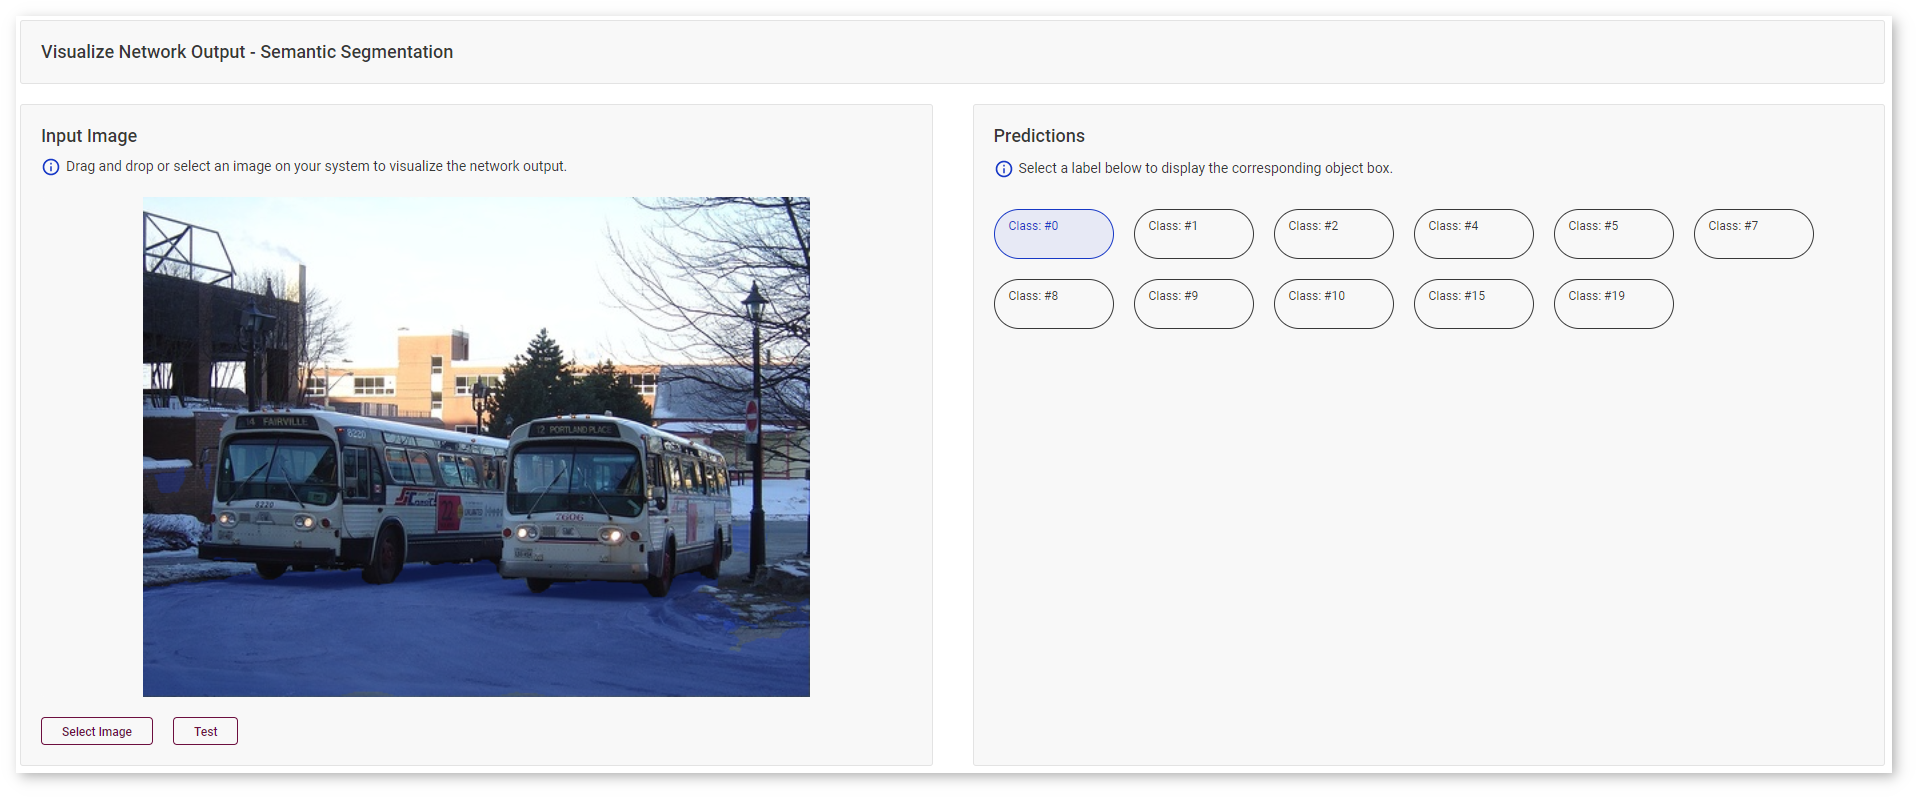
Or the road in the same image:
Super-Resolution Models
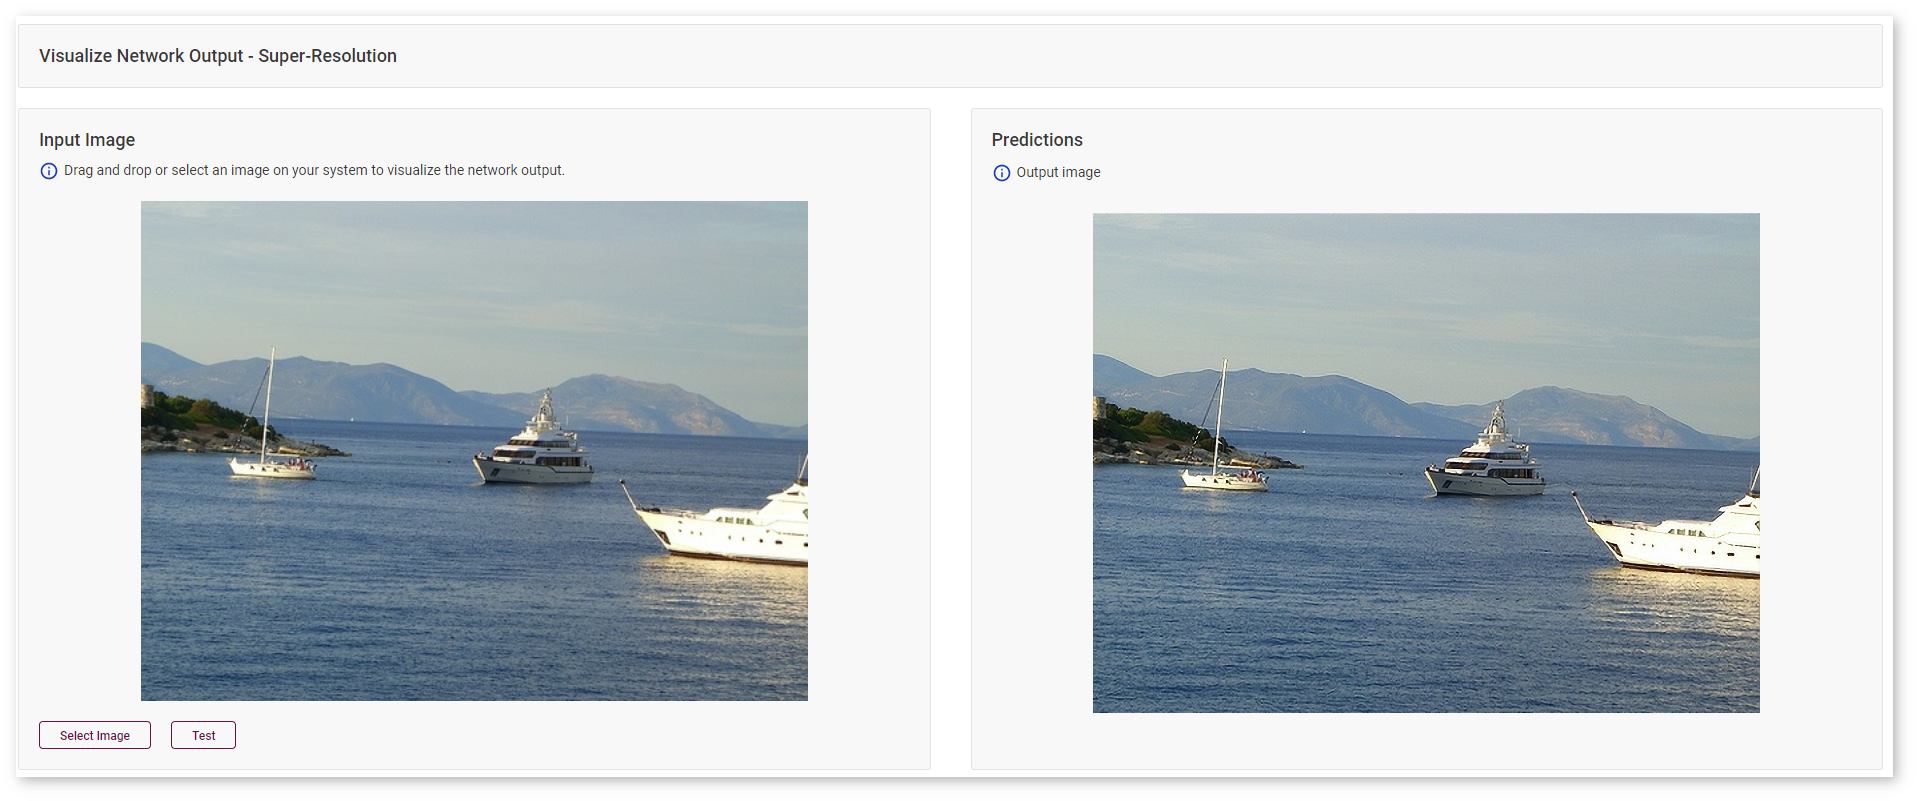
Asses the performance of your super-resolution model by looking at a higher-resolution image on the right:
Style-Transfer Models
For style-transfer models, see the style for which your model was trained applied to a sample image:
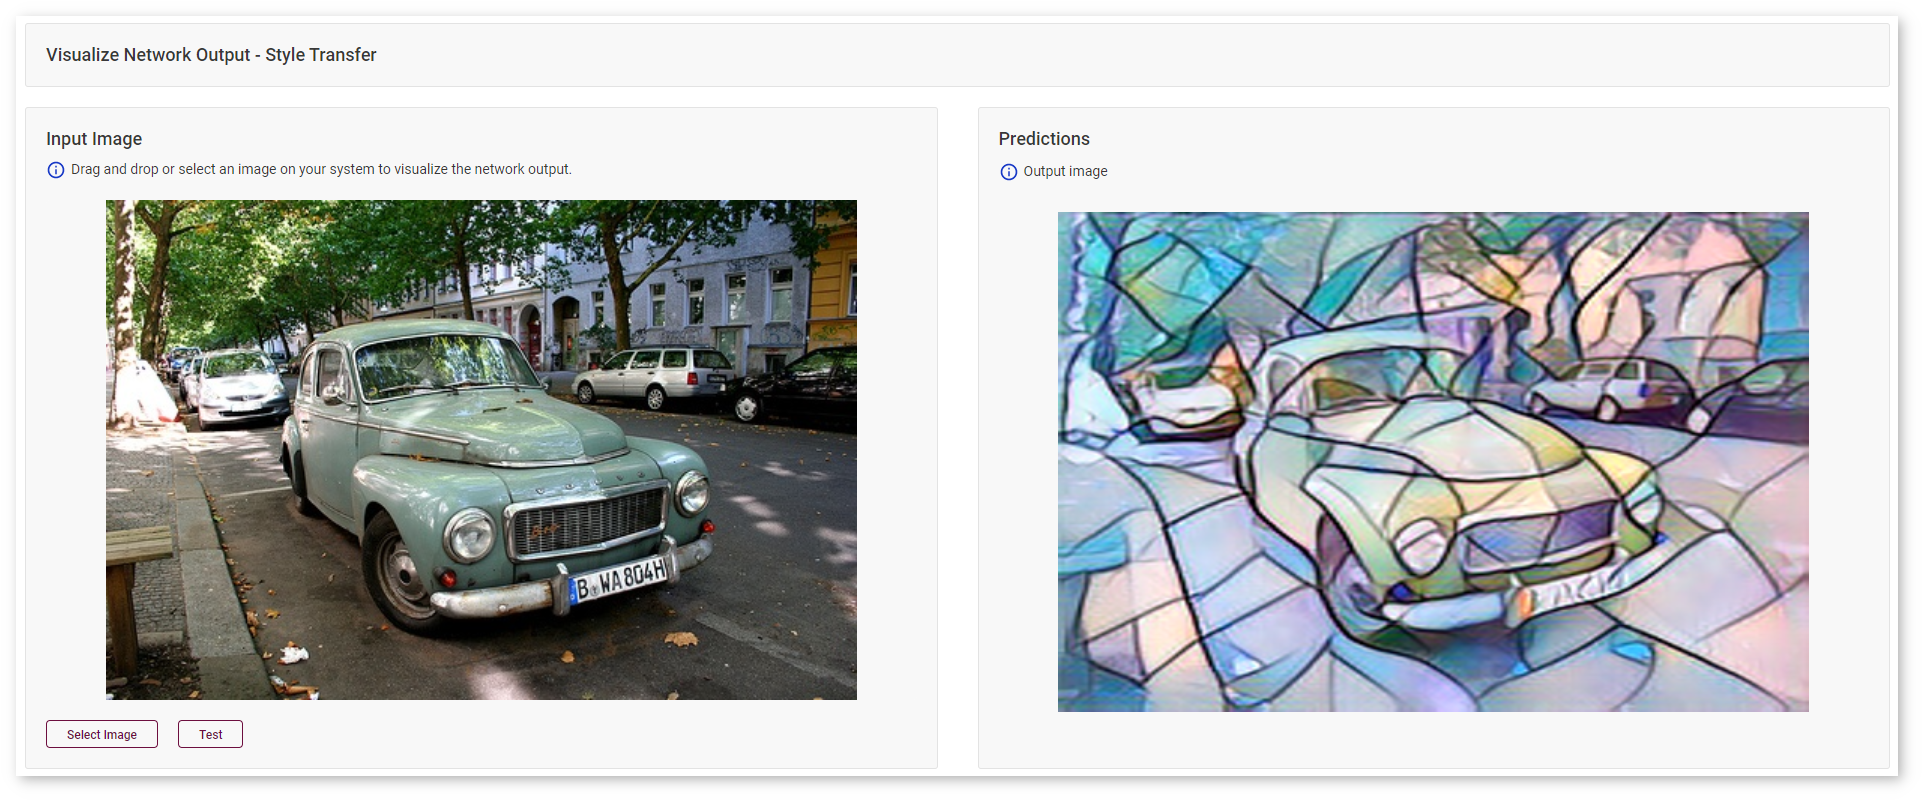
Image-Inpainting Models
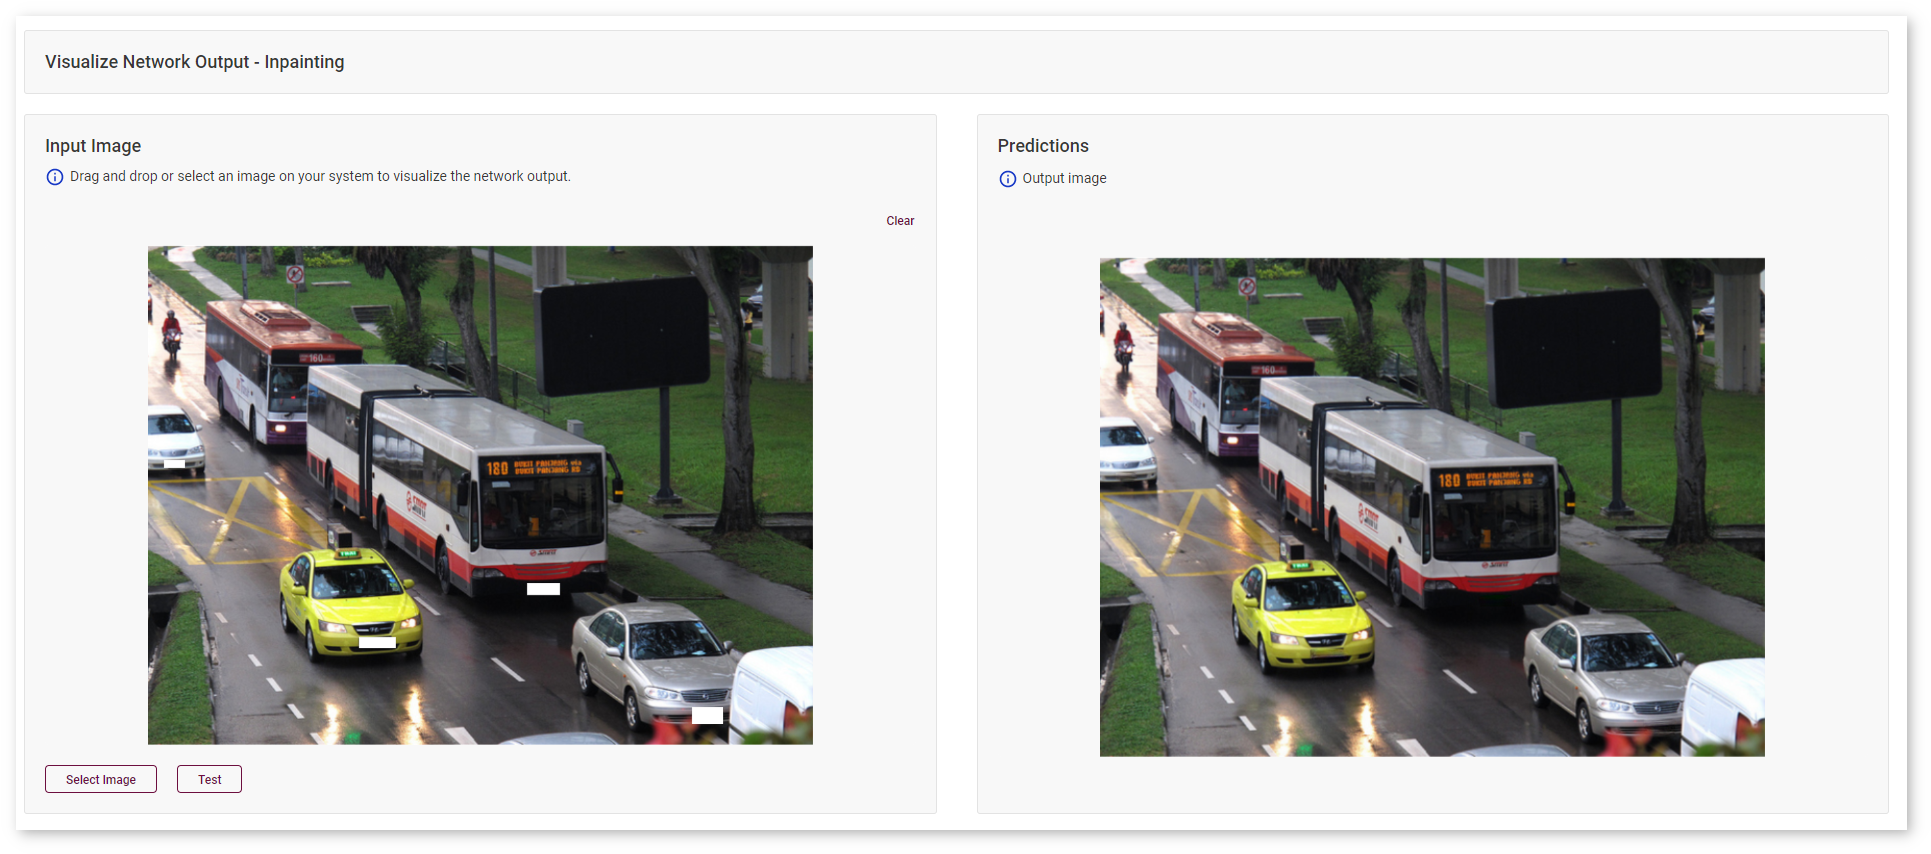
With image-inpainting models, select areas that you want to inpaint on your test image by drawing rectangles.
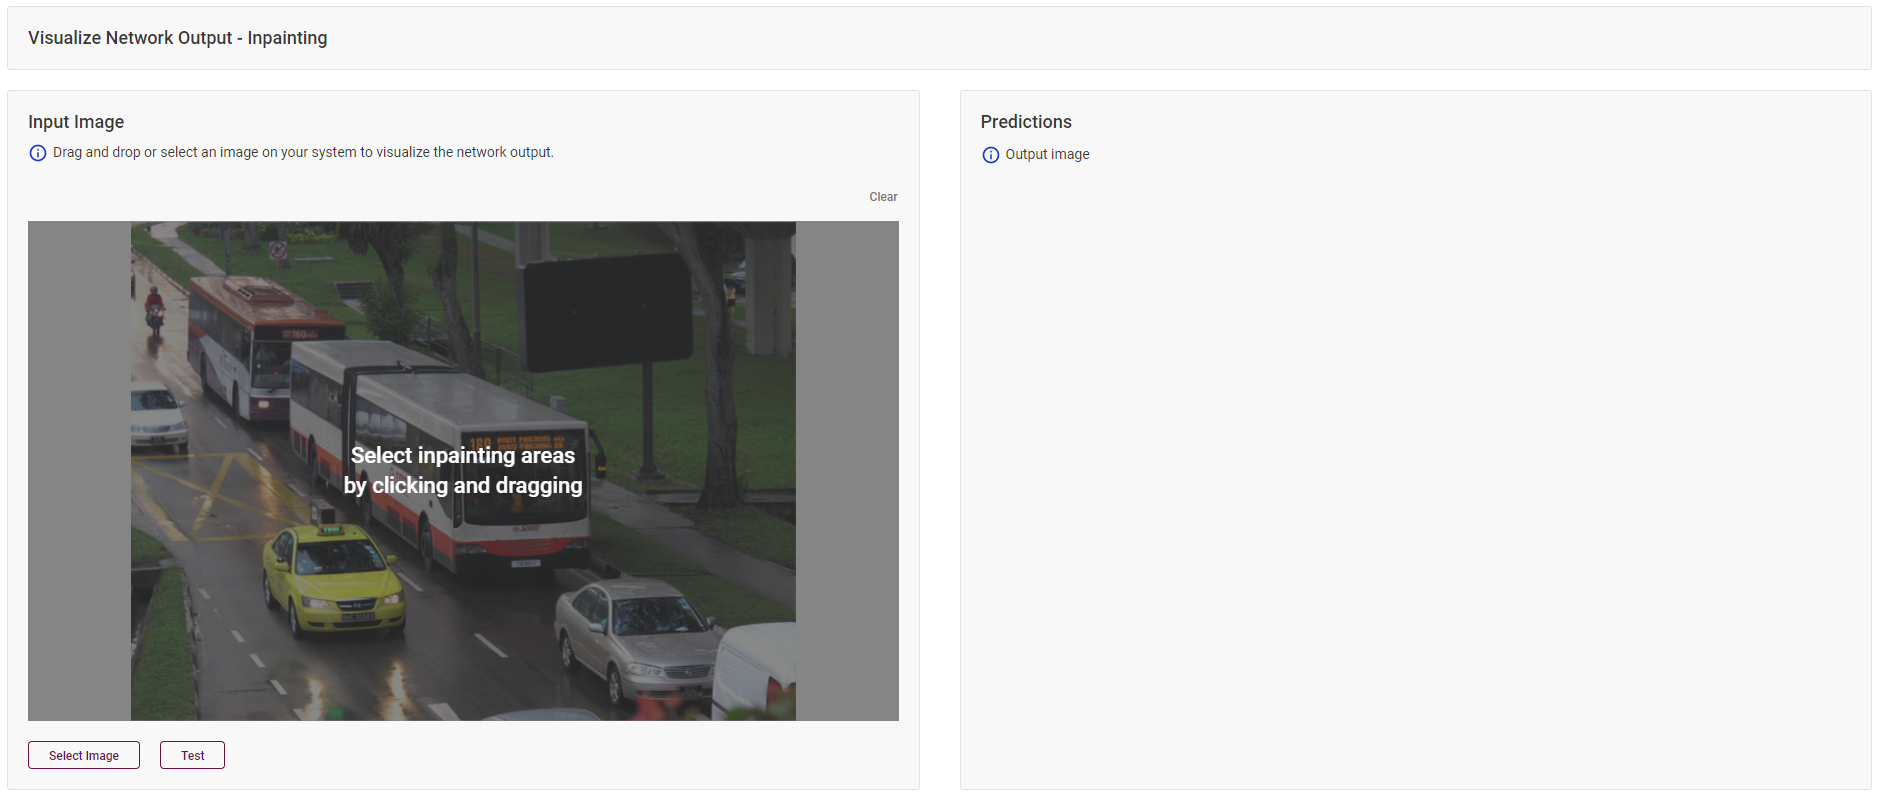
In this example, the goal is to conceal license plates. Click Test and see the result on the right.
Model Predictions with Importance Map
Note
The feature is available for models trained for the Classification use case
Although deep neural models are widely used to automate data processing, their decision-making process is mostly unknown and difficult to explain. Explainable AI helps you understand and interpret model predictions.
Randomized Input Sampling for Explanation (RIZE) algorithm can explain why a black-box model makes classification decisions by generating a pixel importance map for each class. The algorithm tests the model with randomly masked versions of the input image and obtains the corresponding outputs to evaluate the importance.
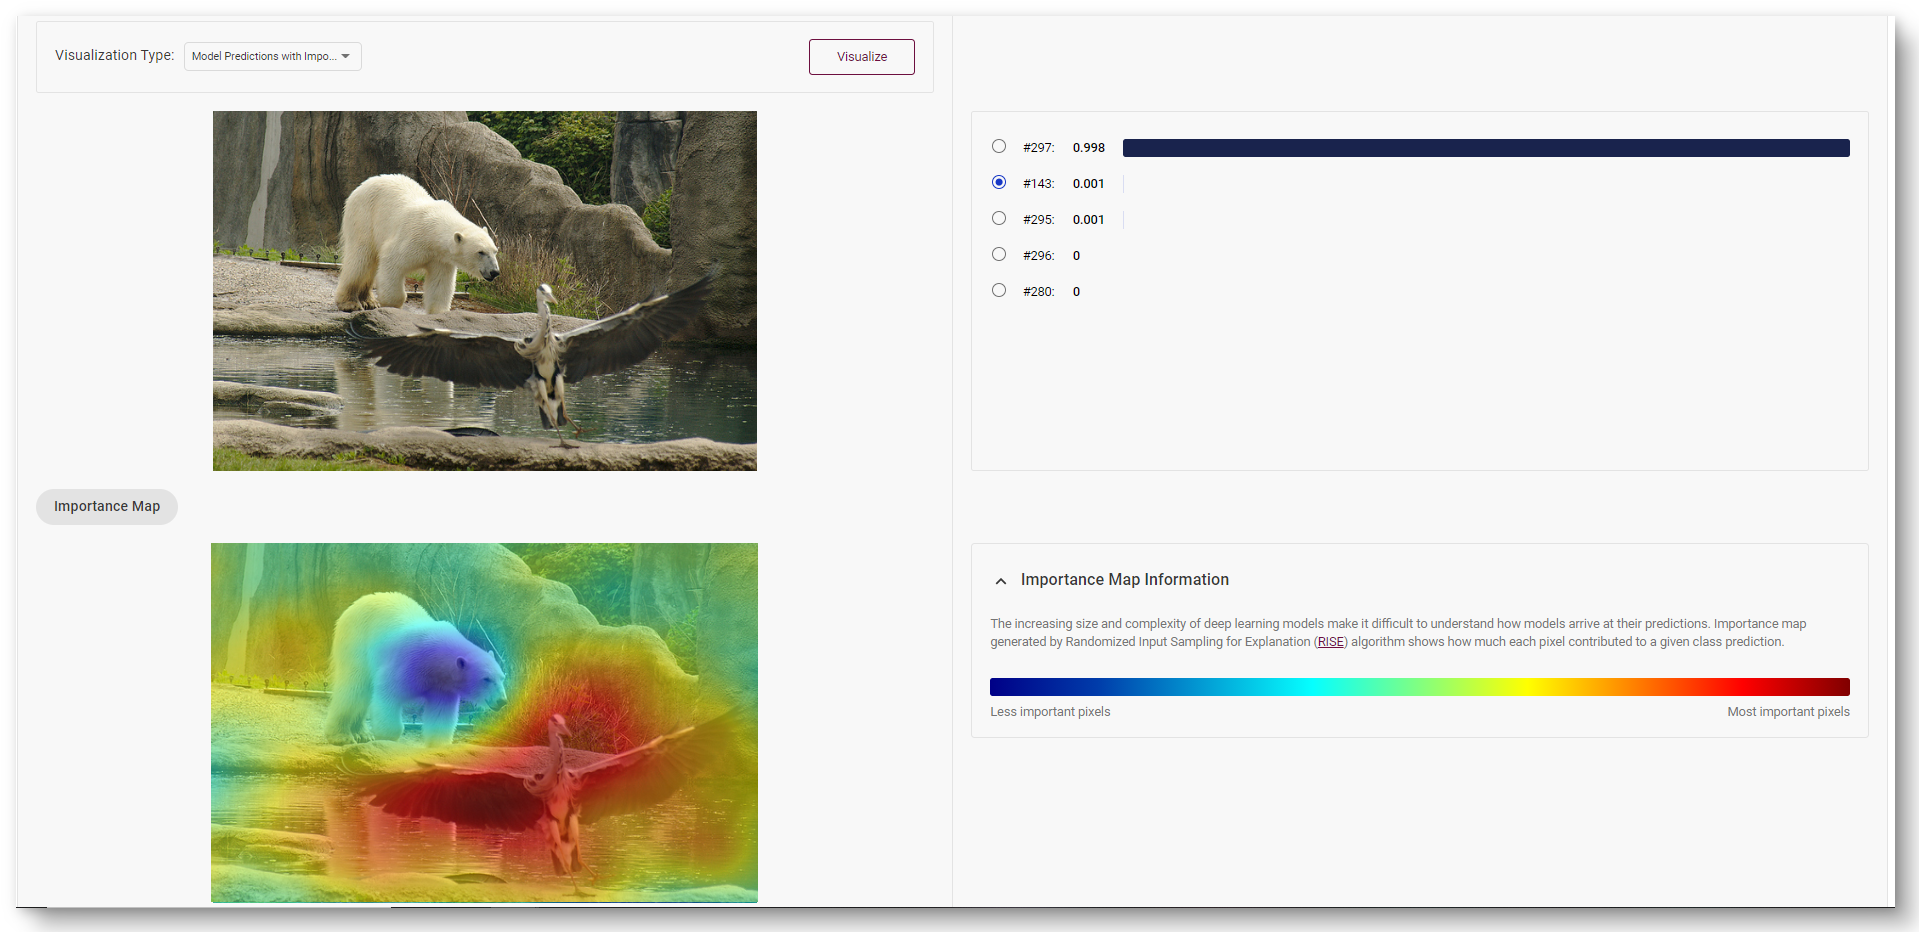
Select Model Predictions with Importance Map visualization type, upload an image and click Visualize button. You will see the progress bar on the right.
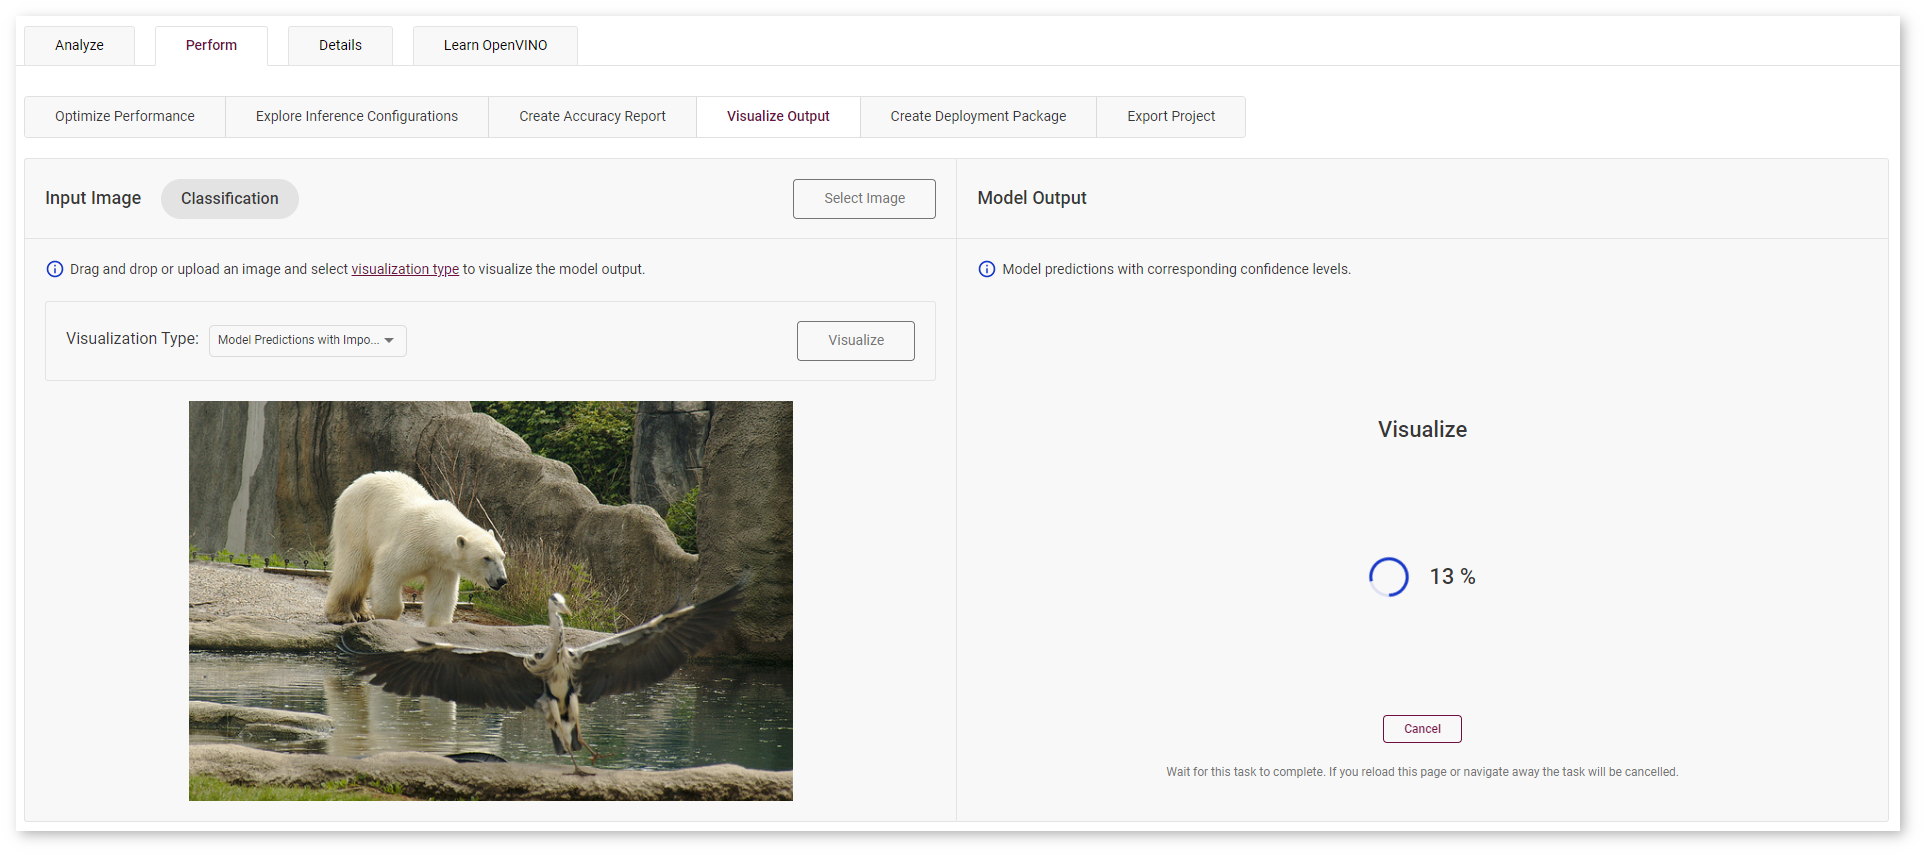
In the images below, red area indicates the most important pixels for class #269 (polar bear). Blue area contains less important pixels for the corresponding model prediction.
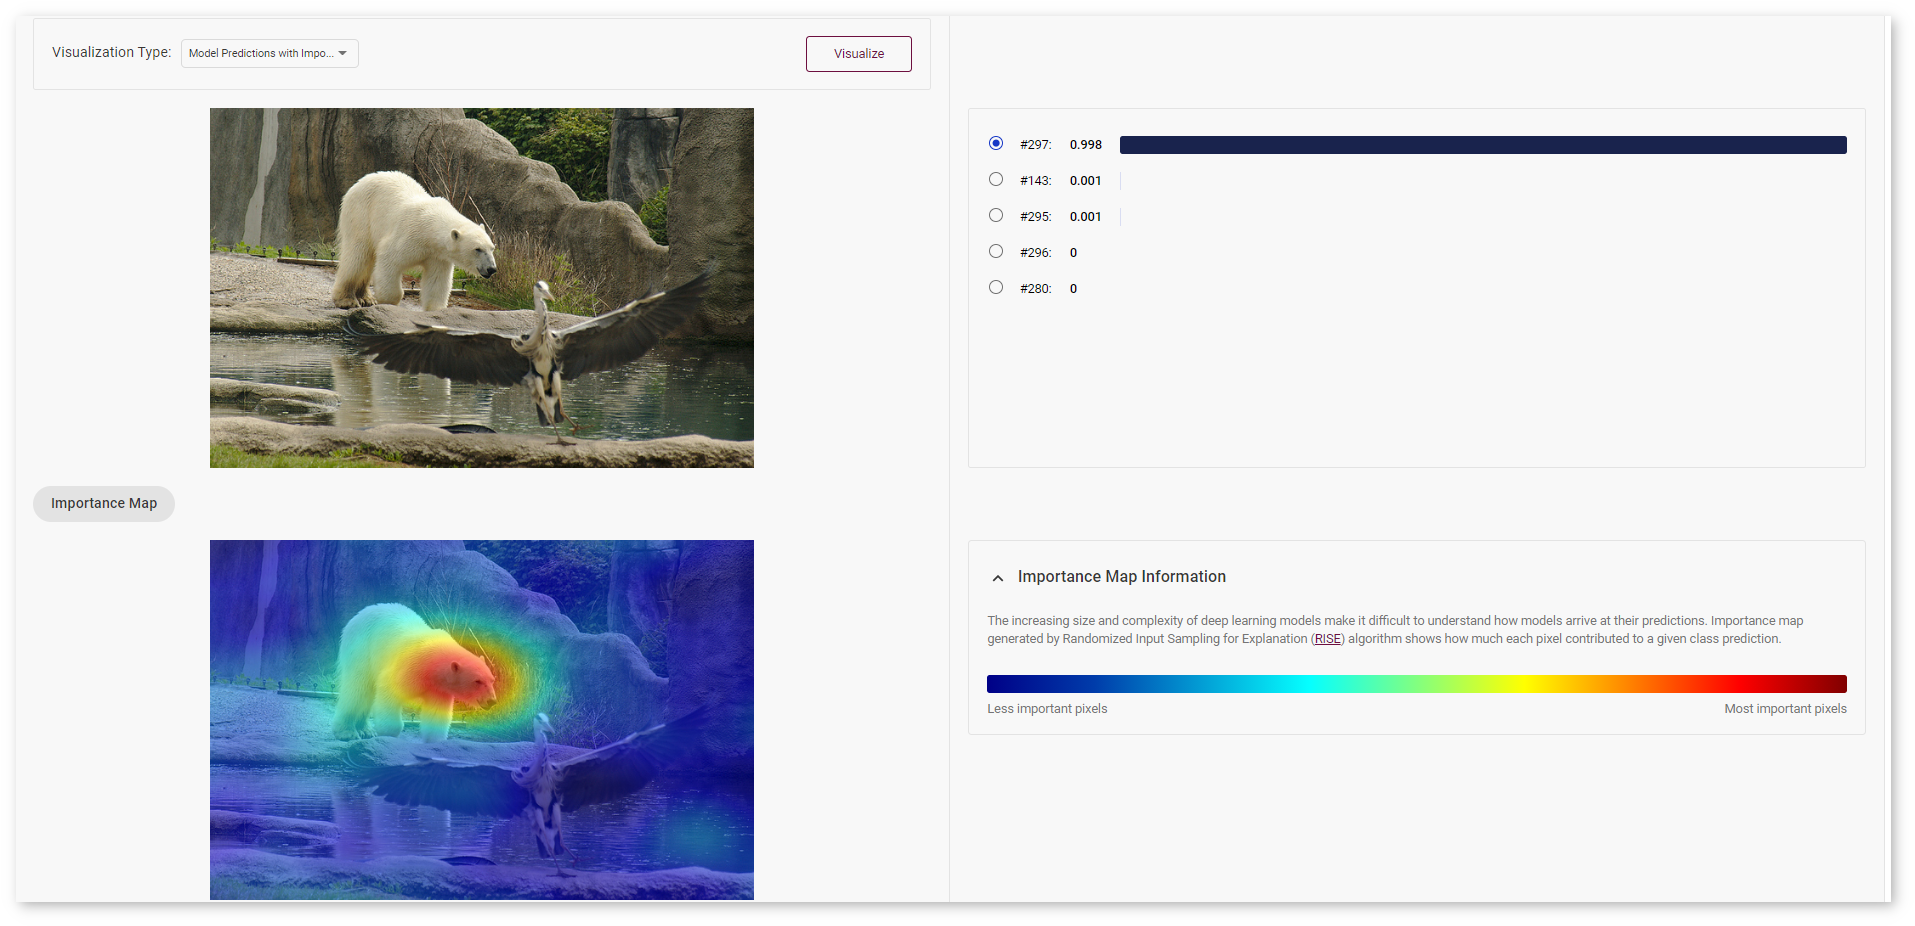
Select another prediction to show the heatmap for class #143 (crane).
Learn more about the RISE algorithm in this paper.
Compare Optimized and Parent Model Predictions
Note
The feature is available for optimized models
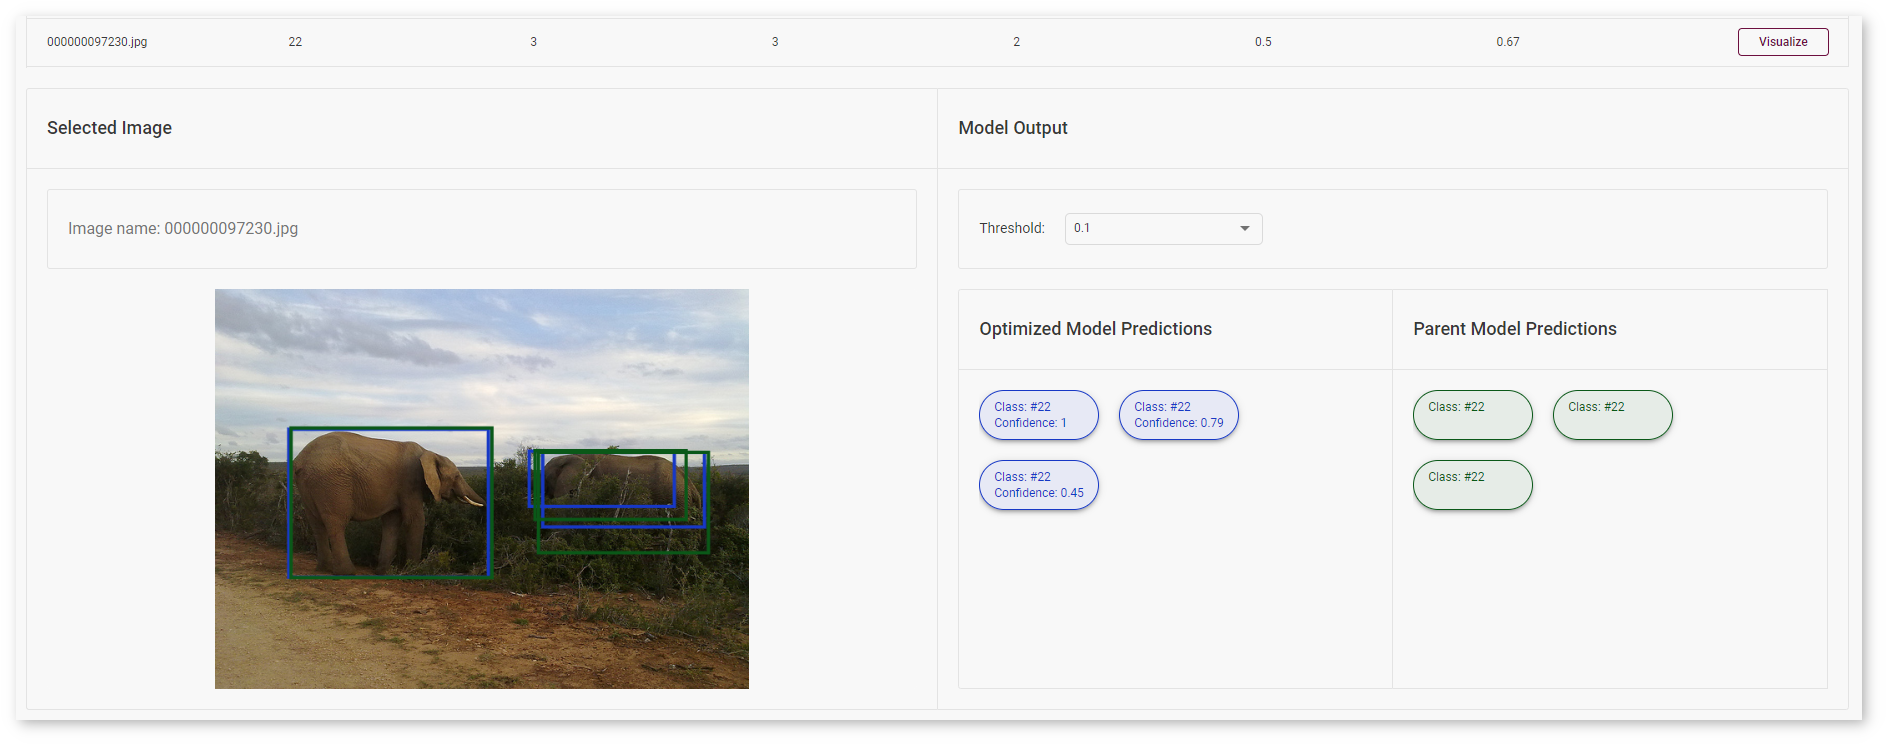
You can compare Optimized model predictions with Parent model predictions used as optimal references. Find out on which validation dataset images the predictions of the model became different after optimization. Learn more at the Create Accuracy Report page.
All images were taken from ImageNet, Pascal Visual Object Classes, and Common Objects in Context datasets for demonstration purposes only.